

Imagine walking down a street and seeing two financial billboards side-by-side. A retail bank advertises a “5% Savings Account,” while a brokerage firm promotes a “5% Annual ETF Return.” To the average consumer, these numbers look identical. The natural assumption is that parking $10,000 in either product will yield the exact same amount of cash by the end of the year.
This assumption is a dangerous financial illusion. Financial institutions utilize entirely different mathematical formulas – such as compound frequency, simple interest, price appreciation, and gross yield projections – to construct these marketing banners. A 5% bank yield behaves fundamentally differently than a 5% market return. Furthermore, both numbers are “gross” figures that completely ignore the silent wealth destroyers: taxes, management fees, and inflation.
To make optimal financial decisions, you must strip away the marketing jargon and learn how to calculate the “True Net Yield” of both deposit accounts and market investments.

Decoding deposit math: Nominal rates versus compound yields
When evaluating bank products – such as High-Yield Savings Accounts (HYSA) or Certificates of Deposit (CDs) – the most critical metric is how the bank calculates the growth of your money over time.
The compounding frequency multiplier
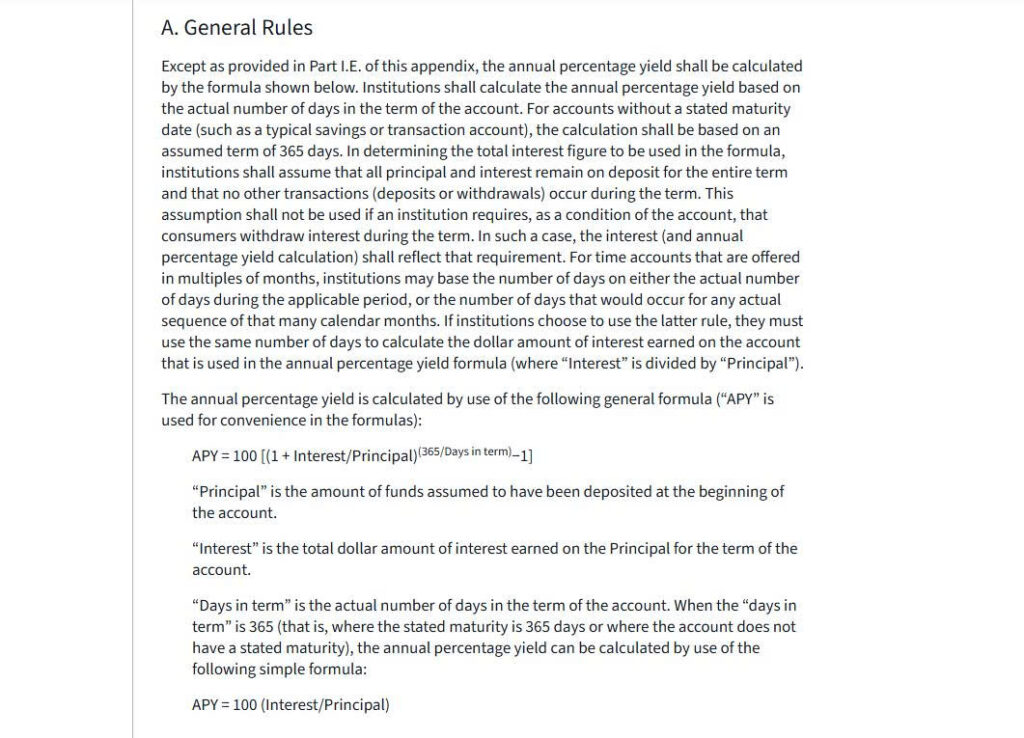
Banks often display two numbers: the Nominal Interest Rate (sometimes called APR) and the Annual Percentage Yield (APY). The nominal rate is the simple, baseline interest your money earns. The APY, however, calculates the true return by factoring in compounding frequency.
Compounding occurs when the bank pays you interest, adds it to your principal balance, and then calculates the next batch of interest on that new, larger total. If Bank A offers a 4.9% nominal rate compounded daily, it will actually generate more cash by the end of the year than Bank B offering a 5.0% nominal rate compounded annually. Always compare deposit products using the APY, as it is the only mathematically standardized metric that reveals your actual cash return.
A predatory tactic used by retail banks is the “Teaser Rate.” A billboard might scream “Earn 6% APY!” but the fine print reveals this rate applies only for the first three months, after which the account drops to a dismal 0.5% standard rate.
To compare this against a fixed-term product, you must calculate the blended return over a full 12-month cycle. Earning 6% for three months and 0.5% for nine months results in an effective annual yield of just 1.87%. By doing the math, you quickly realize that a boring, flat 4% CD is vastly superior to the flashy teaser rate.
Investment math: Why “price return” hides the real profit
When you shift from banking products to stock market investments (like Mutual Funds, Index Funds, or ETFs), comparing returns requires a broader mathematical lens.
Retail investors frequently evaluate a stock by looking exclusively at its historical price chart. If a stock was $100 last year and is $105 today, they assume a 5% return. This is called the “Price Return,” and it tells a woefully incomplete story.
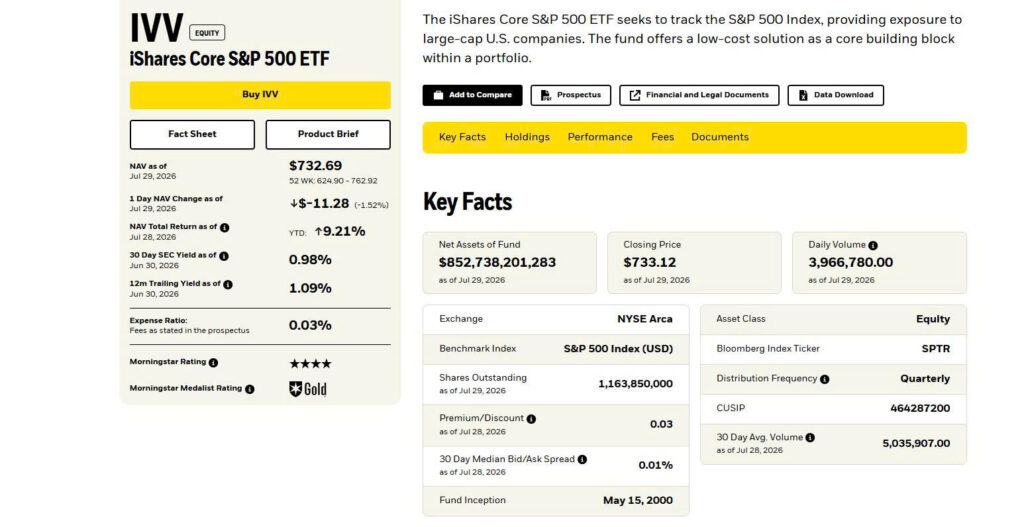
To accurately evaluate an investment, you must calculate the Total Return. Total Return combines capital appreciation (the stock price going up) with the cash payouts generated by dividends or interest distributions.
Consider a stagnant utility stock that started the year at $100 and ended the year at $100. Its Price Return is 0%. However, if that stock paid a 6% cash dividend during the year, its Total Return is 6%. If those dividends were automatically reinvested to buy more fractional shares (triggering compound growth), the true financial momentum is far greater than the flat stock chart suggests. Always insist on comparing funds using Total Return metrics.
The silent wealth destroyers: Fees, taxes, and inflation drag
A 5% gross return is never what actually hits your bank account. Real-world financial friction quietly erodes your wealth. To calculate your “True Net Yield,” you must subtract the impact of taxes and fees.
| Frictional drag factor | Impact on bank deposits (CDs/Savings) | Impact on market investments (ETFs/Stocks) | How to calculate the net loss |
| Tax Treatment | Taxed heavily as Ordinary Income. Added to your salary bracket. | Favorable Long-Term Capital Gains tax if the asset is held for over 1 year. | Subtract your marginal tax bracket percentage from the gross yield. |
| Management Fees | Often zero, unless monthly account maintenance fees apply. | Continuous drag via Expense Ratios (e.g., 0.5% taken directly from the fund’s assets). | Deduct the Expense Ratio directly from the advertised Total Return. |
| Inflation Drag | Fixed nominal return. Highly vulnerable to inflation spikes. | Equities often naturally hedge against inflation over long periods. | Subtract the current inflation rate (CPI) from your after-tax yield to find the “Real Return.” |
The tax distinction is particularly brutal for high earners. If you earn 5% APY in a bank account but fall into a 35% income tax bracket, your government takes more than a third of your interest, dropping your actual net yield to 3.25%. Conversely, holding an ETF for longer than a year usually qualifies for significantly lower long-term capital gains tax rates, allowing you to keep a much larger slice of your profit.
Furthermore, do not ignore investment expense ratios. A mutual fund charging a 1% annual management fee will mathematically consume hundreds of thousands of dollars of your potential compound growth over a 30-year retirement timeline.
Liquidity penalties and lock-in period calculations
Finally, when comparing financial products, you must calculate the hidden cost of accessing your own money.
Fixed-term bank deposits (like CDs) lock in a guaranteed APY, but they enforce rigid Early Withdrawal Penalties. If an emergency forces you to break a 1-year CD after six months, the bank’s penalty can legally erase up to 6 months of accrued interest. This effectively drops your APY to 0% and entirely negates the purpose of the deposit.
In contrast, liquidating an ETF or stock carries no fixed bank penalty. However, the “penalty” takes the form of market volatility. If you are forced to sell an ETF during a sudden market crash, you lock in capital losses. This is why financial math dictates that money needed within a short 1-to-2-year timeline must be parked in guaranteed deposit accounts, while money meant for long-term growth (5+ years) should weather the volatility of Total Return investments.
Frequently asked questions about financial yield calculations
Why do banks require “new money” to qualify for their highest APY promotional rates?
Banks use aggressive promotional APYs as a marketing expense to acquire fresh liquidity from competitors. They mandate “new money” (funds transferred from an external institution) to prevent existing customers from simply moving their already-deposited funds into the higher-yield account, which would cost the bank money without increasing their total deposit base.
How do I find the accurate Total Return history for a mutual fund or ETF?
Do not rely on basic stock charting apps like Apple Stocks or Google Finance, as they only display Price Return. To find the Total Return, read the fund’s official prospectus or fact sheet provided by the asset manager (like Vanguard or BlackRock), and specifically look for the performance chart labeled “Assuming Reinvestment of Dividends.”
Should I prioritize a high-yield CD or an index fund if my investment timeline is under two years?
Mathematics dictates that any capital needed within a short 1-to-2-year timeline should prioritize capital preservation over growth. Market volatility can easily erase 20% of an index fund’s value in a single bad year. Therefore, a guaranteed, fixed-APY bank product (like a CD or HYSA) is the only mathematically sound choice for short-term goals like a house down payment, despite the tax drag.